Prerequisites
To follow along with the instructions on this page it will be useful to have:- a running Parallax client instance.
- basic working knowlegde of bash/terminal.
Monitoring stack
The Parallax client collects lots of data which can be read in the form of a chronological database. To make monitoring easier, this data can be fed into data visualisation software. On this page, the Parallax client will be configured to push data into a InfluxDB database and Grafana will be used to visualise the data.Setting up InfluxDB
InfluxDB can be downloaded from the Influxdata release page. It can also be installed from a repository. For example the following commands will download and install InfluxDB on a Debian based Linux operating system - you can check for up-to-date instructions for your operating system on the InfluxDB downloads page:localhost:8086. Before using the influx client, a new user with admin privileges needs to be created. This user will serve for high level management, creating databases and users.
Setting up Prometheus
Prometheus can be downloaded from the Prometheus. There is also a Docker image at prom/prometheus, you can run in containerized environments. eg:Preparing the Parallax client
After setting up database, metrics need to be enabled in the Parallax client. Various options are available, as documented in theMETRICS AND STATS OPTIONS in prlx --help and in our metrics page. In this case the Parallax client will be configured to push data into InfluxDB. Basic setup specifies the endpoint where InfluxDB is reachable and authenticates the database.
Setting up Grafana
With the InfluxDB database setup and successfully receiving data from the Parallax client the next step is to install Grafana so that the data can be visualized. The following code snippet shows how to download, install and run Grafana on a Debian based Linux system. Up to date instructions for your operating system can be found on the Grafana downloads page.localhost:3000. A browser can be pointed to that URL to access a visualization dashboard. The browser will prompt for login credentials (user: admin and password: admin). When prompted, the default password should be changed and saved.
The browser first redirects to the Grafana home page to set up the source data. Click on the “Data sources” icon and then click on “InfluxDB”. The following configuration options are recommended:
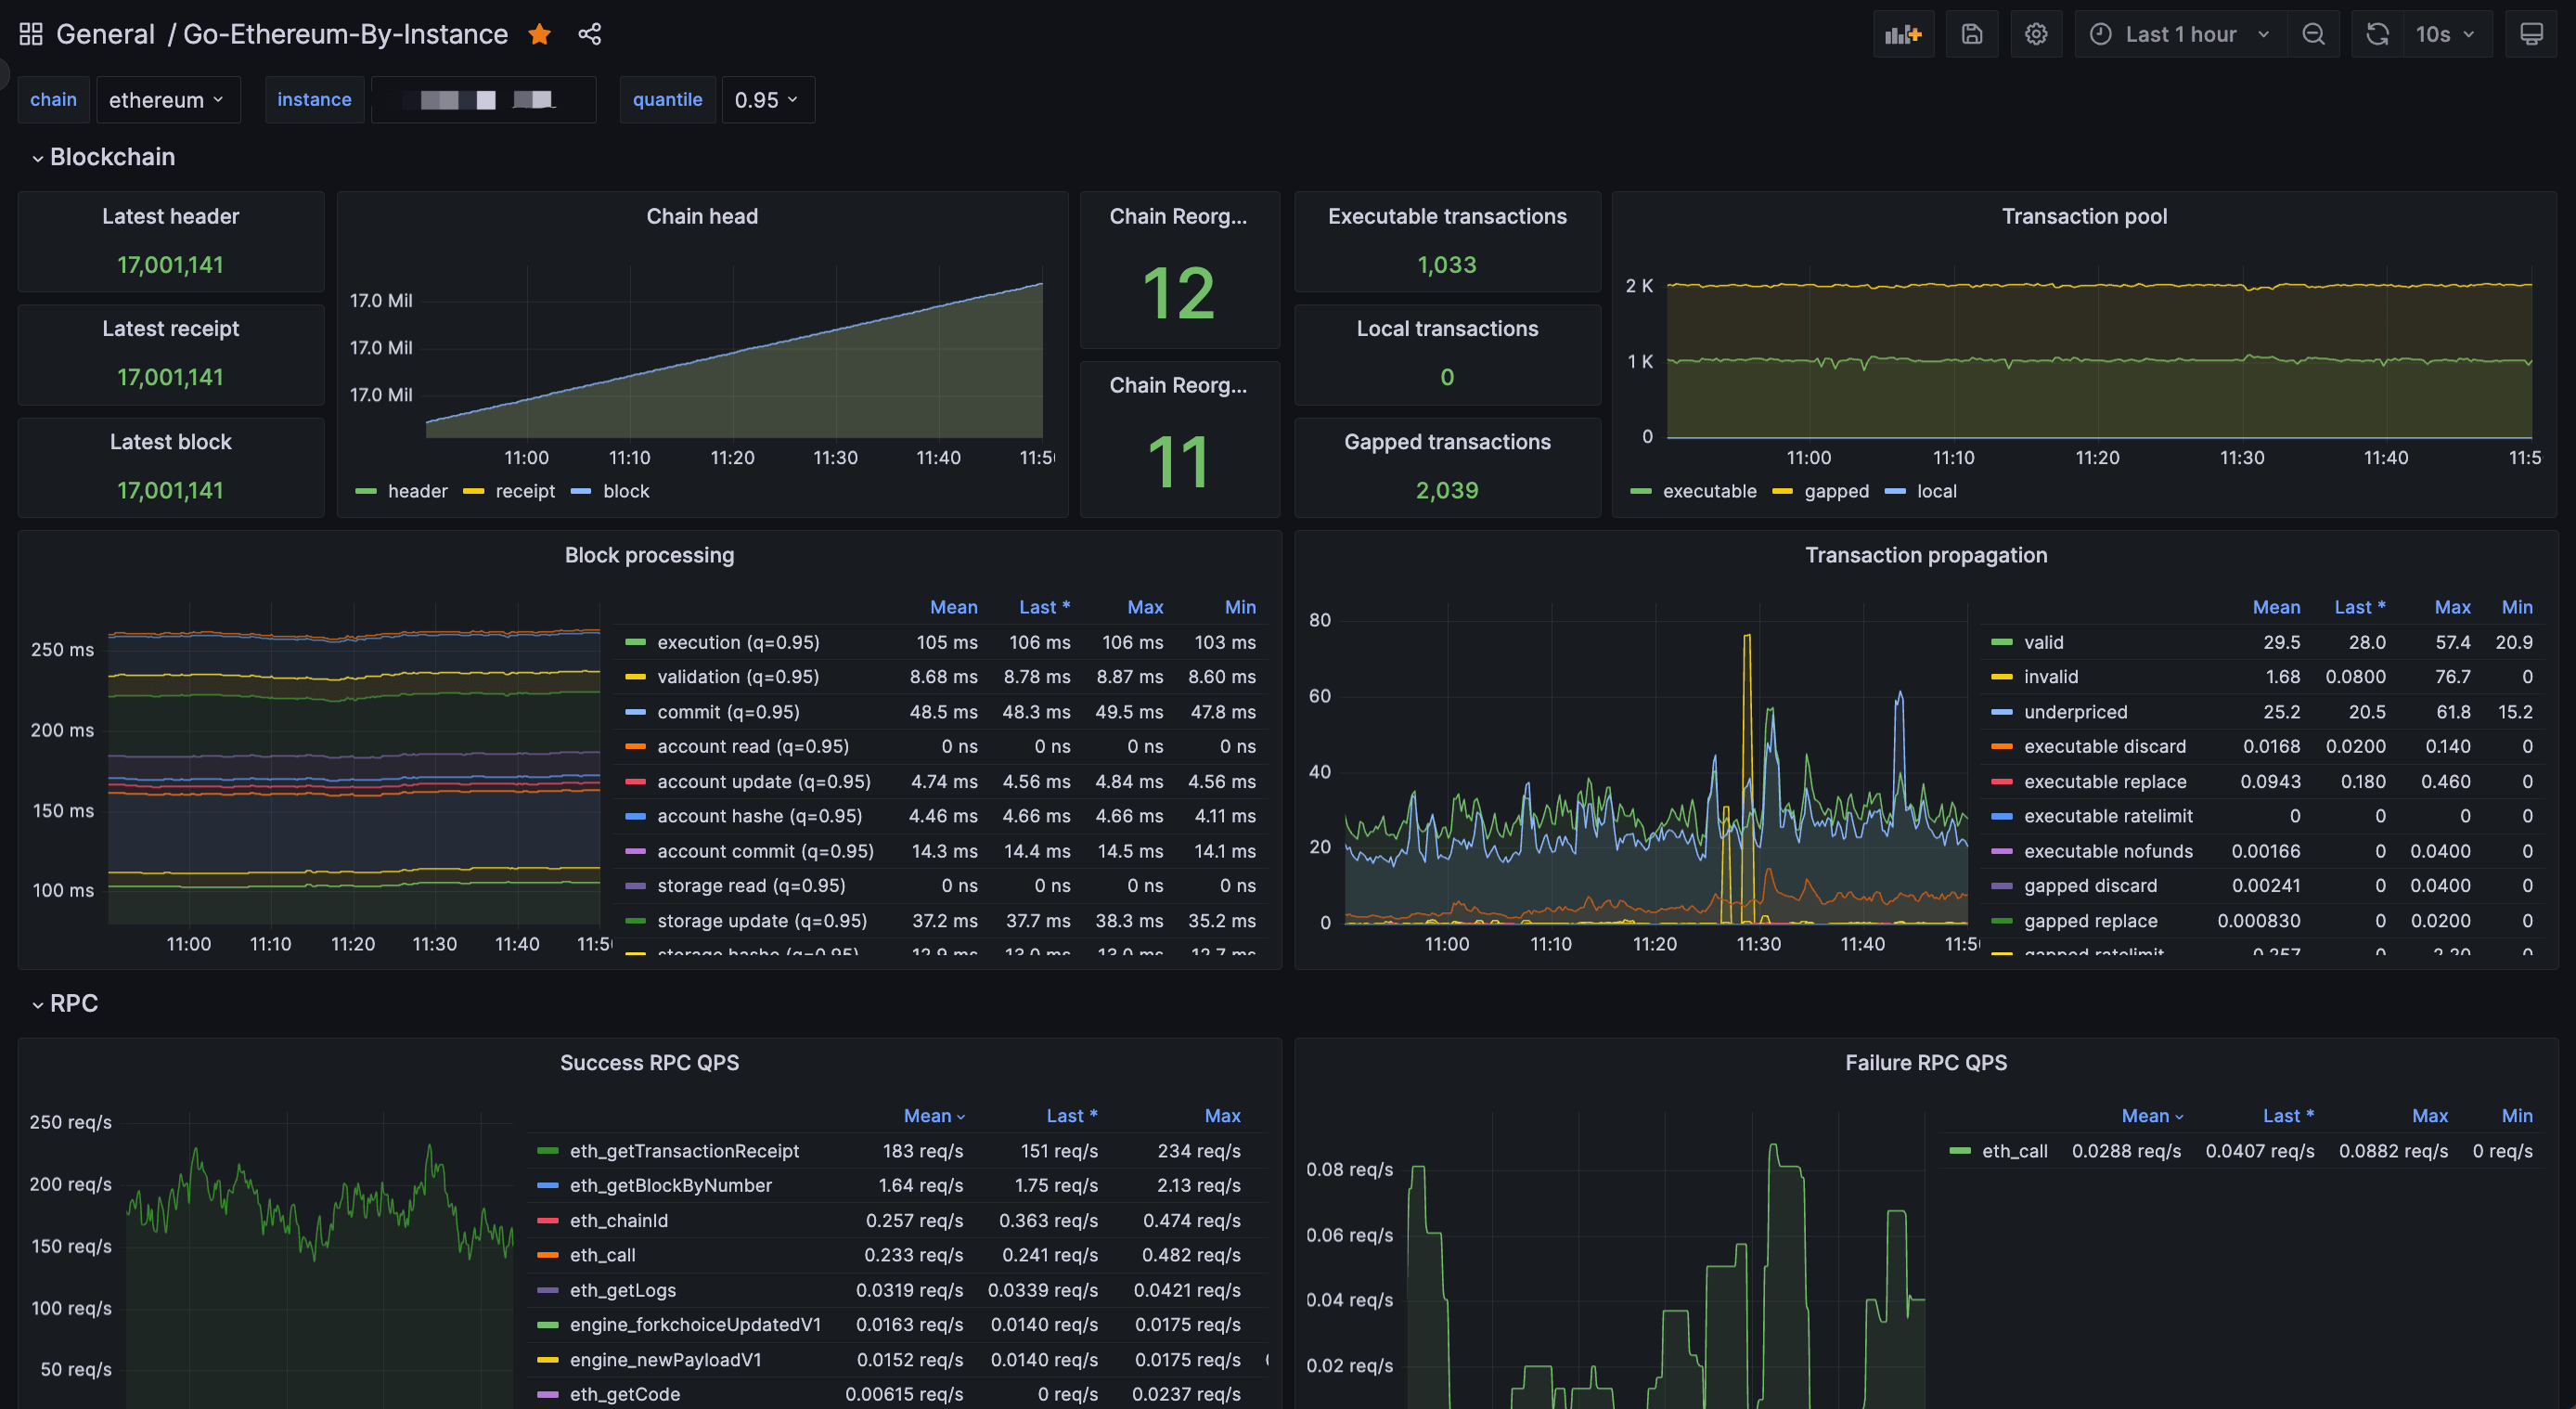
 For a Parallax client Prometheus monitoring dashboard, copy the URL of this dashboard and paste it in the “Import page” in Grafana. After saving the dashboard, it should look like this: